Ops Dashboard
Route: /ops · Edition: Community+
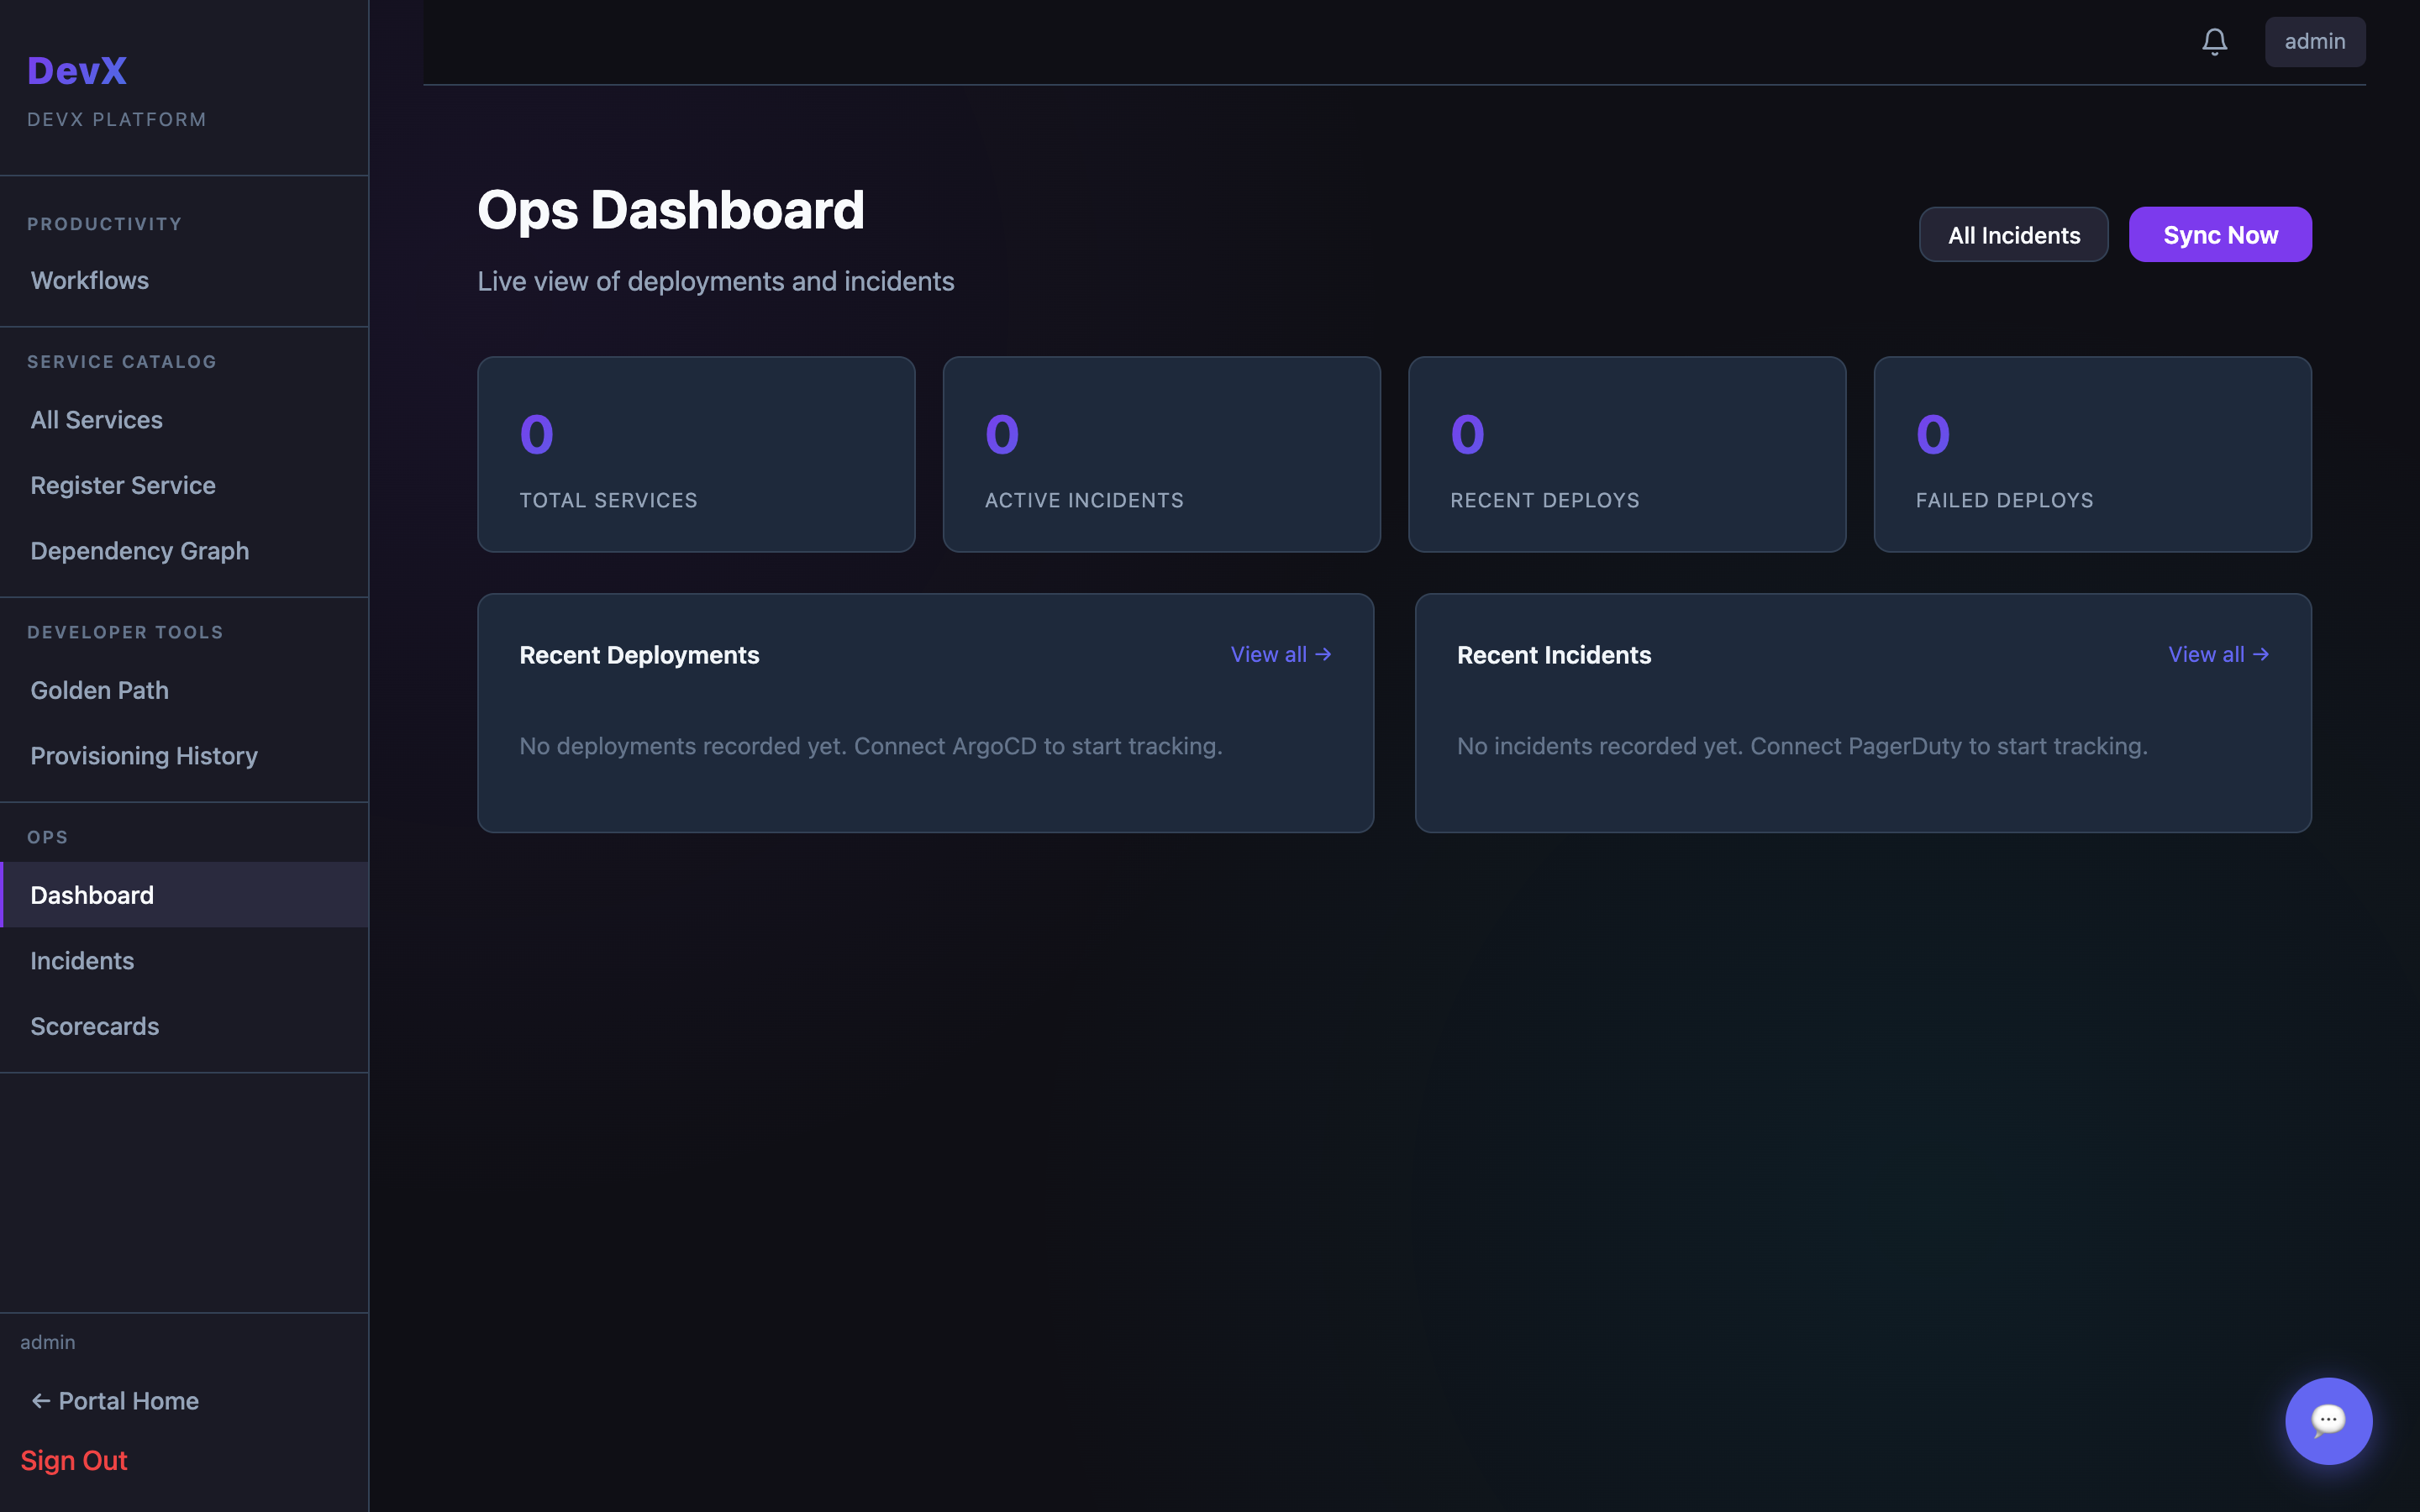
The Ops Dashboard aggregates deployment frequency, incident rate, and DORA metrics across all services. It gives engineering leads a single pane of glass for operational health.
DORA metrics
| Metric | Source |
|---|---|
| Deployment Frequency | ArgoCD deployment events |
| Lead Time for Changes | Time from commit to deployment |
| Change Failure Rate | Deployments that triggered an incident |
| Mean Time to Recovery | Average incident resolution time |
DORA data is collected automatically when ArgoCD and PagerDuty integrations are configured.
Recent deployments
A chronological list of deployment events across services, showing service name, version, environment, and outcome (success / failed).
Recent incidents
The last N incidents from the DRM tracker, with severity, affected service, and resolution time — so you can correlate deployments with incident spikes.
Manual collection
Click Collect Now to trigger an immediate metrics collection run outside the normal scheduler cycle.